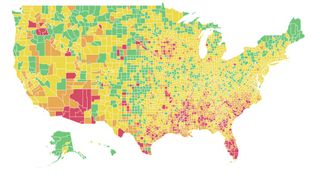
The easily-interpreted color-coded system emerges in light of a new framework, designed to offer “clear, accessible guidance to policy makers and the public on how to target and suppress COVID-19 more effectively across the nation.” The interactive map will make decision-making easier by adding local and nationwide context to safety-related decisions. A green risk level denotes a coronavirus case in less than one per 100,000 people, meaning the virus is on track for containment in this area. On the other end of the scale, red areas (many of which are in Arizona and Florida) have over 25 COVID-19 cases per 100,000 people, indicating that you ought to stay at home. The map is designed to target uncertainty, which the Harvard Global Health Institute describes as the ‘currency of pandemics’. Danielle Allen, director of the Edmond J. Safra Center for Ethics at Harvard University, emphasizes the collective need “to keep focused on what should be our main target: a path to near zero case incidence.” The aim for the risk rating system is COVID-19 suppression at every level, and even those areas with the green light require viral testing and contact tracing, according to Harvard’s ‘Key Metrics For COVID Suppression’ framework. The COVID-19 hotspot map shows local risk levels ahead of 4th of July travel, so check it before committing to any plans. You can do that here (opens in new tab). If you do decide to go ahead with a 4th of July cookout or social gathering, check out the CDC guidance on how to make it safer (opens in new tab) before firing up your gas grill (opens in new tab).